- Published on
Creating a virtual data warehouse in Redshift
- Authors
- Name
- Marat Levit
- @MaratLevit


Photo by R Mo on Unsplash
With the introduction and general availability of materialized views, I wanted to explore the possibility of creating “virtual” data warehouses. By virtual, I am referring to a warehouse that is built without ETL tools (i.e., Talend, Informatica, dbt, or Dataform for that matter).
Now obviously the entire warehouse can’t be completely virtual, we still generally recommend organisations build integration layers (something along the lines of Data Vault) but in all honesty, you could bypass that if you’re not integrating many source systems and if your organisation is not likely to change its core systems/ways of working.
The data warehouse
Let’s briefly introduce a typical data warehouse architecture.

A typical warehouse consists of three layers, staging, integration, and presentation. All data for the warehouse is sourced from our data lake and made available for consumption within the presentation layer.
Now let’s overlay the above with the appropriate AWS services.
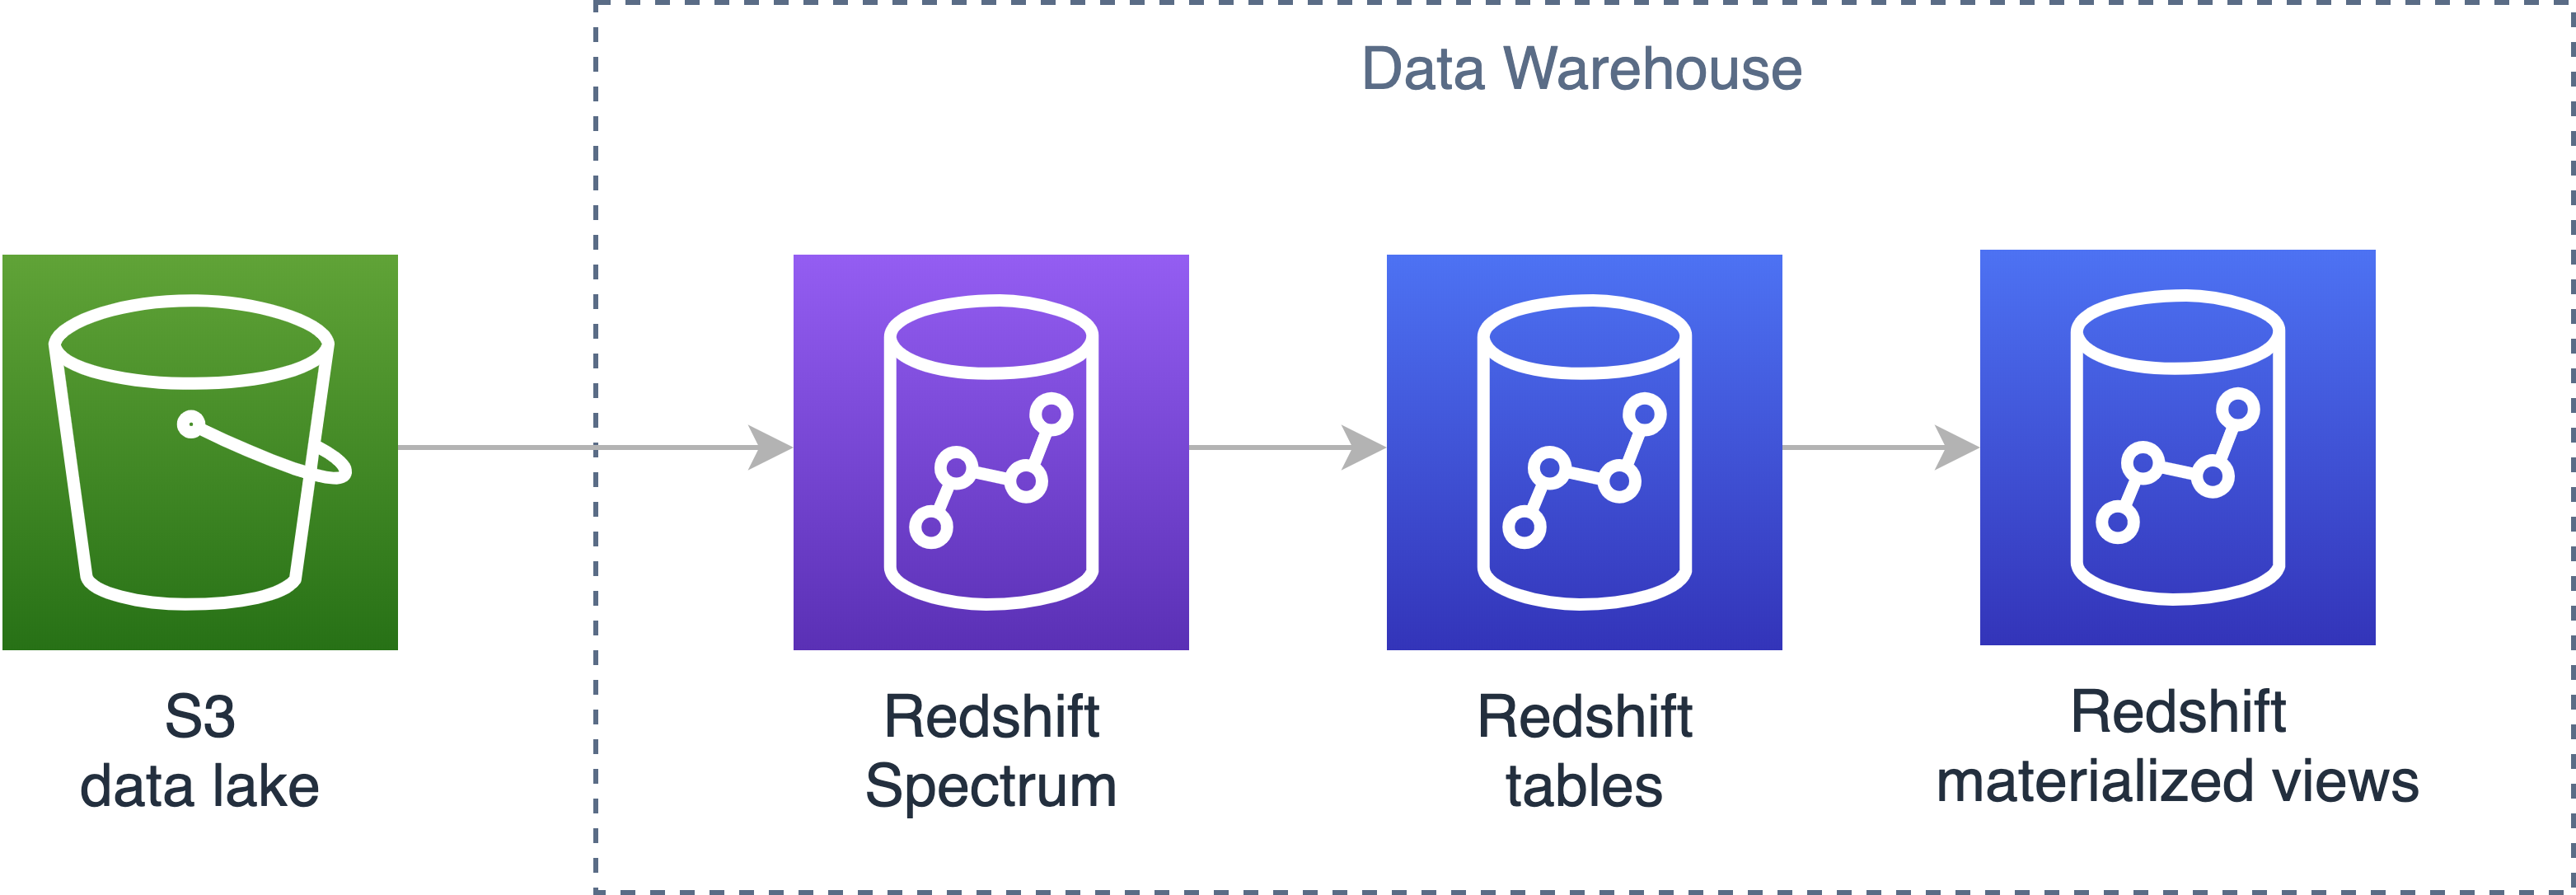
Our data lake is, of course, Amazon S3 (no surprises there), our staging layer is not actually physicalised within Redshift but actually just Redshift Spectrum querying our Amazon S3 data lake, the integration layer (if required) is comprised of tables within Redshift and finally, we have our presentation layer. Up until this point, the presentation layer has always been physicalised (think tables)… but now we can actually virtualise it without compromising on performance thanks to materialized views.
The solution
I created a simple database within Redshift to learn about and understand materialized views. I converted MySQL’s Sakila database to Redshift (found here on GitHub) for use in this solution.
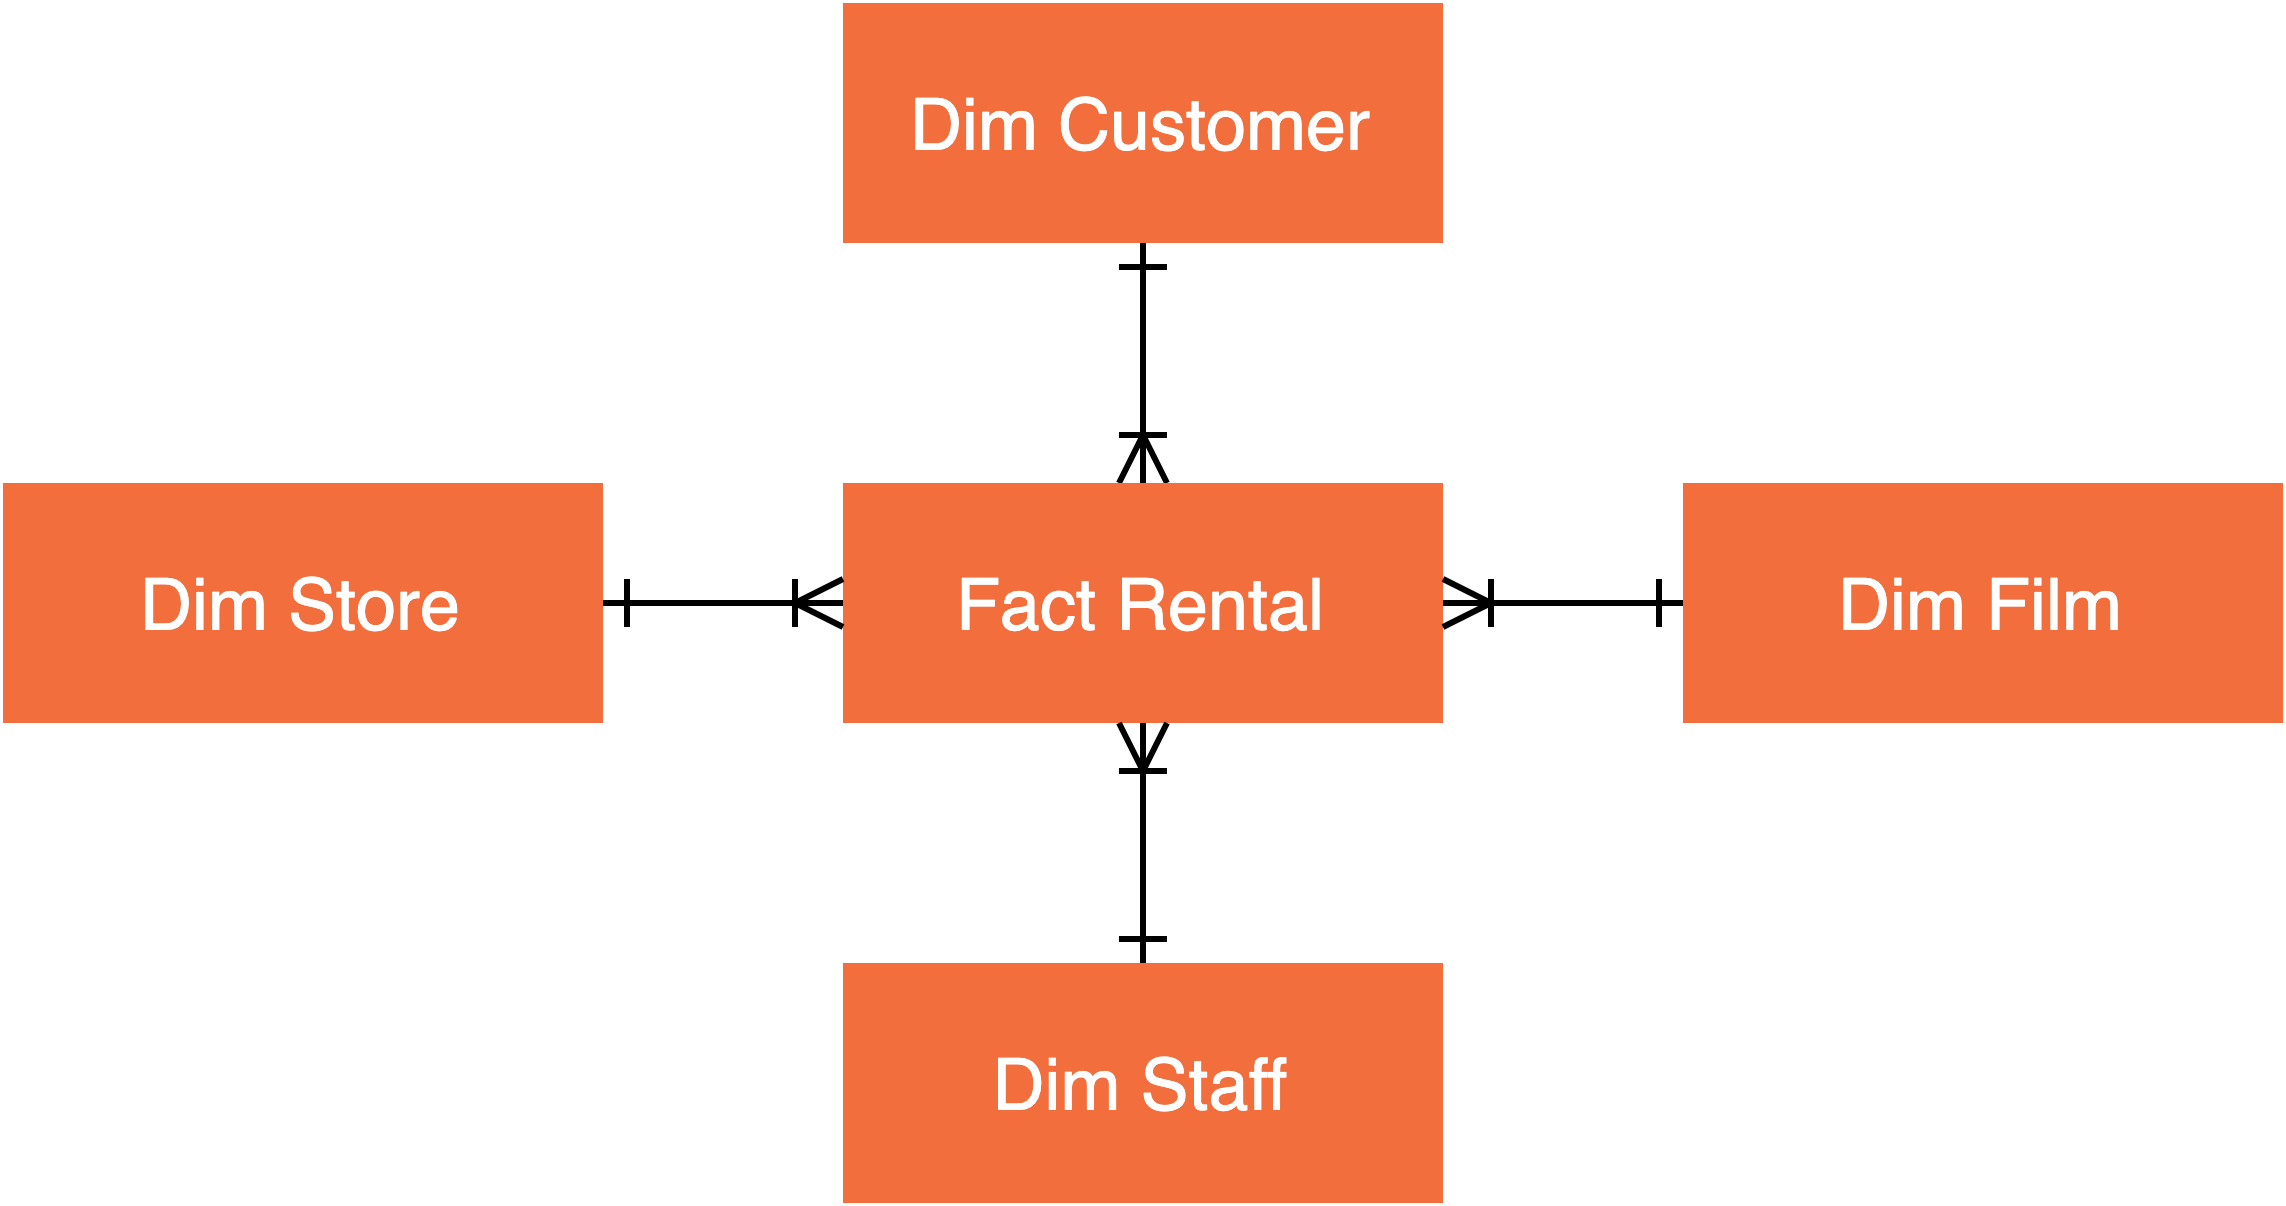
The solution consists of one fact, rental, and four dimension tables, customer, film, staff and store. For those visual learners out there, he’s a crummy ER diagram :)
This is the point where we begin to utilise the materialized views. Instead of typically using tables for our dimensions and facts, we instead create five materialized views. Below you’ll find an example of fact_rental and dim_customer.

As you can see, materialized views act similarly to tables, they can be distributed and sorted to ensure performant joins and queries.
To refresh the data within the materialized view, you simply run REFRESH MATERIALIZED VIEW sakila.fact_rental and Redshift will perform either an incremental refresh or a full refresh depending on the SQL constructs used within the view. This is all handled automatically by Redshift.
In many cases, Amazon Redshift can perform an incremental refresh. In an incremental refresh, Amazon Redshift quickly identifies the changes to the data in the base tables since last refresh and updates the data in the materialized view.
Refreshing the data within the views should be built into your data processing pipeline. Once the previous layers have been populated (new data has been ingested) a simple refresh call is made to update the presentation layer. No ETL processes, no data pipelines.
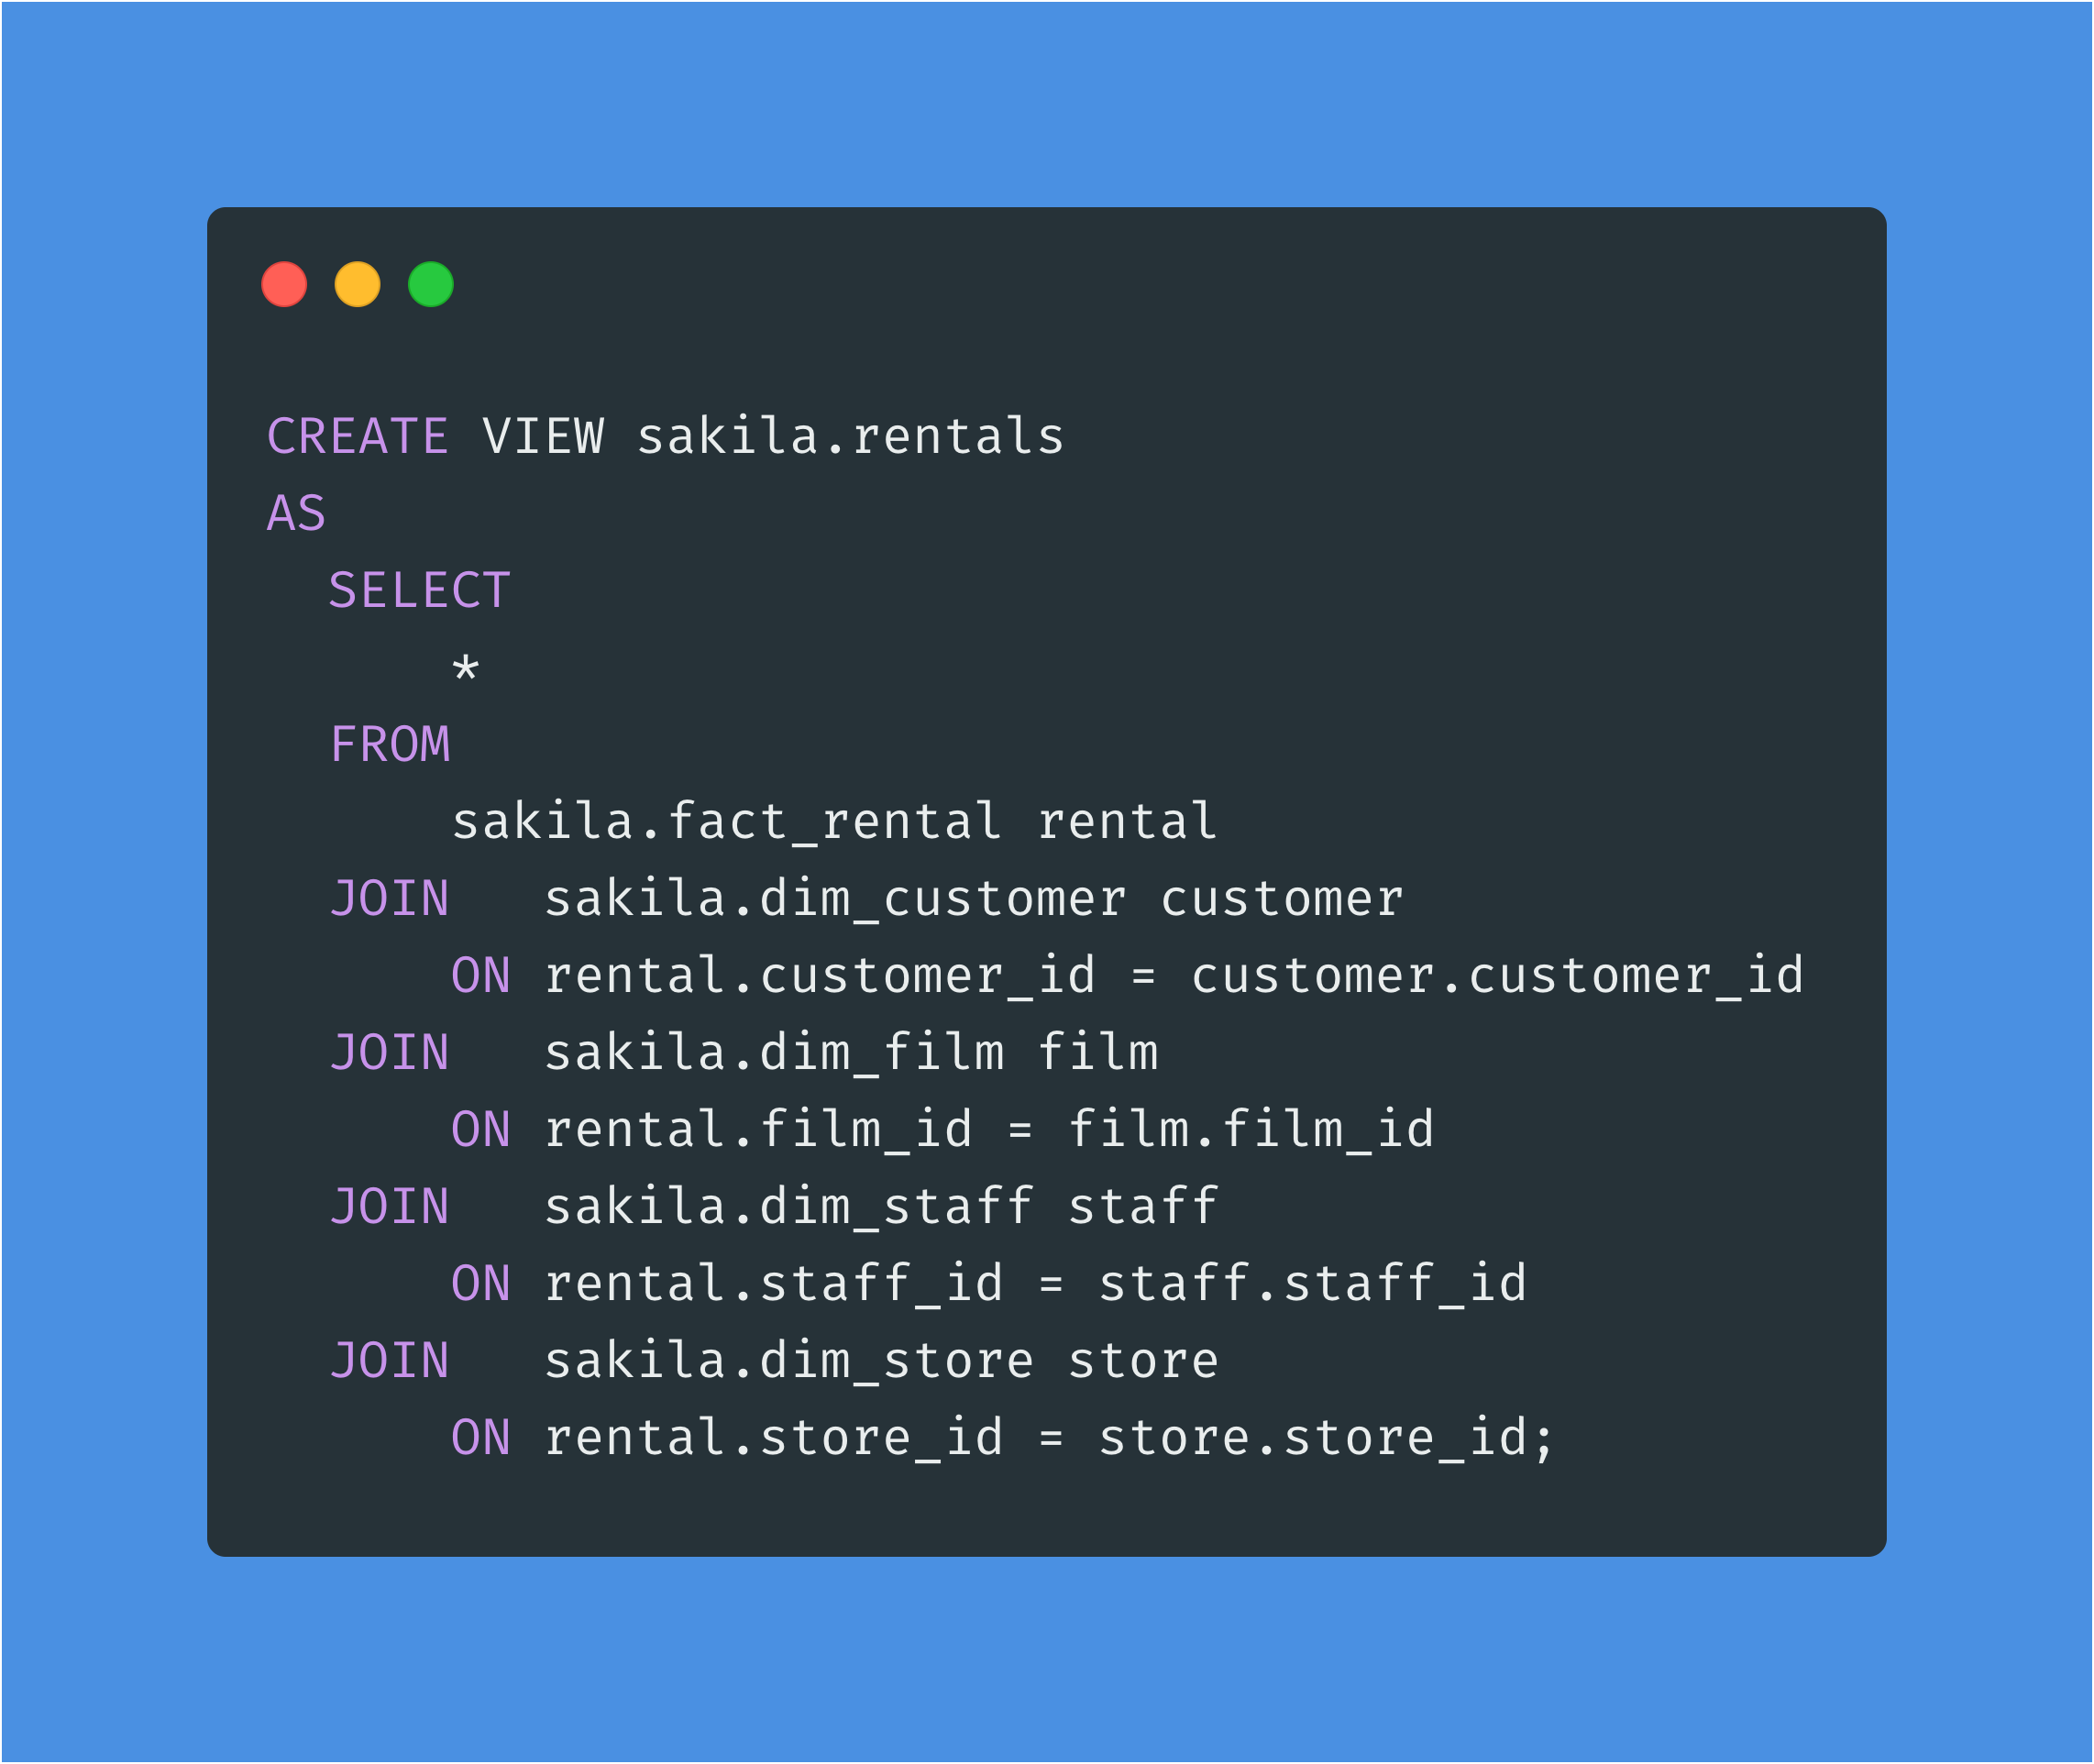
The final step is to create one denormalized view for easier consumption by our consumers (this is where distribution plays an important role, see Amazon Redshift Performance Standards for Data Vault for tips).
Final thoughts
Firstly, please don’t hang me for the not-so-realistic dimensions and facts. Yes they’re not perfect, yes there are no point-in-time joins etc :) It’s just an example.
Secondly, Redshift’s implementation of materialized views is actually quite mature. There’s no auto-refresh of data (would be nice to see), but the fact that it allows joins between tables already puts it head and shoulders above its main competitors (i.e., Snowflake & BigQuery).
Thirdly, the use of Redshift Spectrum to create a virtual staging layer and materialized views to create a virtual presentation layer reduces data engineering effort and increases data delivery velocity. That’s a win-win in anyone's books.